
Excel can be a very useful tool. Though it cannot easily do the most advanced statistical tasks. Excell can tackle most everyday business analytics. Today we see how a business advisor discusses a range of challenges including smoothing data.
Balanced Scorecards
Ron Person shows how to produce balanced scorecards in a book that is packed with neat tricks and practical suggestions. He shows how to do Box-and-Whisker Plots, custom labels and even Gantt (project management) charts. Person explains how to put all the tricks together to create interesting dashboards in Excel. This includes some useful ideas on how to improve the presentation of the data.
Smoothing Data
A problem he discusses is erratic data. Sometimes data is quite messy. For example, each week’s sales jump around a lot, but you really want to make the trends easy to see. An approach to achieve this is to smooth the data. Person explains how to do this, even going so far as to give the simple code to use in Excel. He also highlights the strength and weaknesses of the approach.
Moving averages are used to smooth erratic data so that you can see the underlying pattern. They work by taking an average of data over a time period. That average smooths erratic spikes or dips but also “flattens” the data, causing rapid changes to be lost or delayed.
Person, 2013, page 318
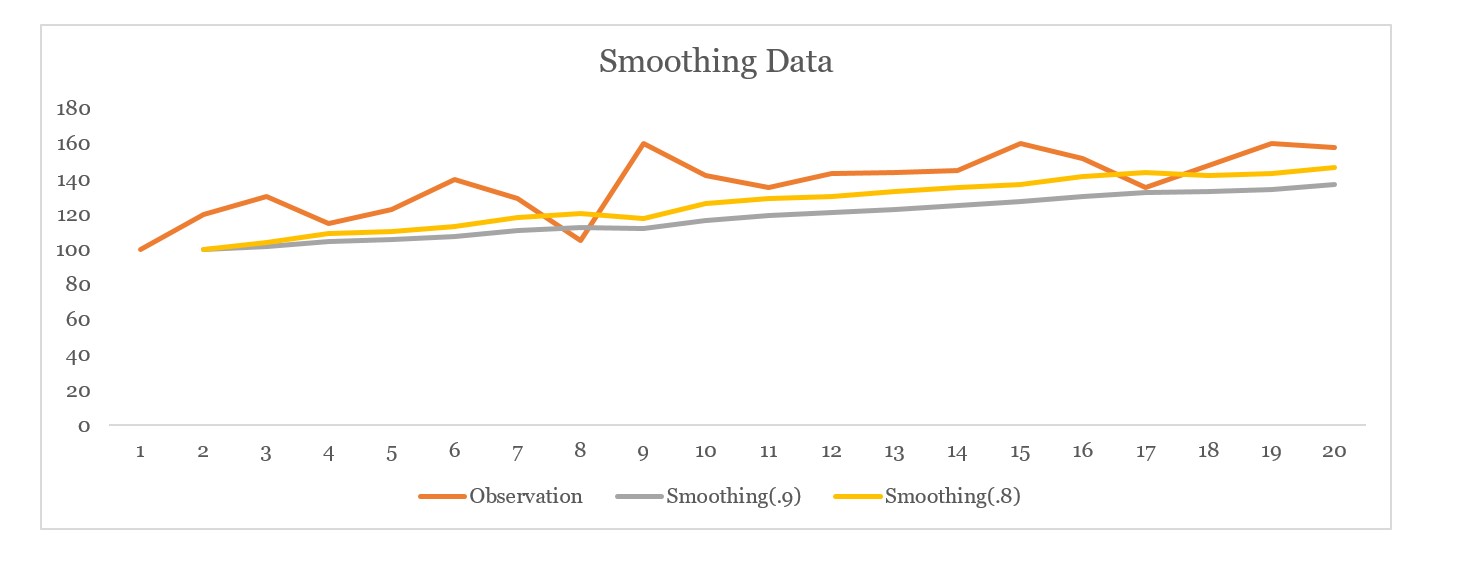
You rarely get anything for free. Smoothing data will allow you to see the trend much more easily. Generally, the longer the averaging period you use the more the trend will be clear. (For example, all else equal, smoothing data over a month is likely to show an easier-to-see trend than smoothing over a week). The challenge is that long periods tend to obscure changes. Perhaps a dramatic change has occurred recently. Such an occurence will be lost in data smoothed over a long time period. One trick Person shows is to weight the average more heavily towards more recent periods which somewhat compensates for the problem.
Smoothing data can be useful and if you want to do it in Excel, or simply want some other useful tricks, Person’s book can certainly help.
For more on balanced scorecards and presentation of data see here, here, here, and here.
Read: Ron Person (2013) Balanced Scorecards & Operational Dashboards with Microsoft Excel, John Wiley and Sons, Inc.