
One of the strangest things in statistics is Simpson’s paradox. The paradox happens when two sets of data each show the same result. Yet, when you combine the data into a single data set the combined table gives you a different result.
Data Can Be Confusing
Smith explains this using a click data example. In the data, he shows when you look at aggregate data a two-click format is more profitable for the entire group than a one-click format. One might conclude that the two-click is better as it performs best in aggregate.
This conclusion might be an expensive mistake
Smith, 2014, page 112
The problem is that when you dig into the data there are two groups, U.S. and international customers. It is strange to notice that the one-click format is actually better for both groups of customers. What is going on?
Simpson’s Paradox
The explanation is that in the example there are relatively more US customers using the two-click format than the one-click format. The US customers are much more profitable. The relatively high number of the more profitable type of customers in the two-click format makes it look more profitable but it is not the format that is more profitable. It is that the specific format happens to have more of the profitable customers. If you compare like with like you notice that one click is simply better.
As Smith says:
The Key to being alert to a possible Simpson’s Paradox is to think about whether a confounding factor has been ignored
Smith, 2014, page 112
Another Example
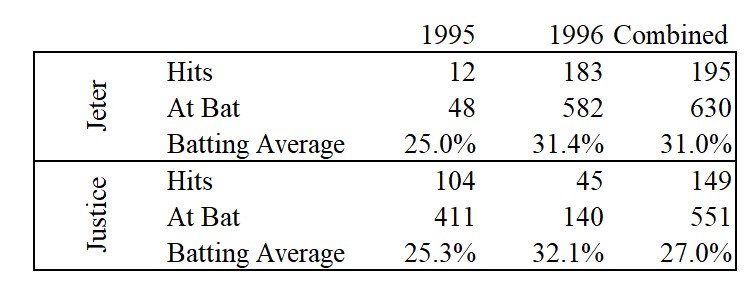
I borrowed another example from Wikipedia (credited to Ken Ross). In this David Justice had a better batting average in both 1995 and 1996. Derek Jeter, on the other hand, had a clearly better average over the entire two-year period (31.0% versus 27.0%). The ‘trick’ is that the years are not the same size. Both players were better in 1996 than 1995 but Jeter had most of his at bats in 1996. This was the good year for both. Justice had the majority of his at bats in 1995, when neither were doing as well. Jeter’s combined average is most impacted by his 1996 performance whereas Justice’s is driven by his 1995 performance.
Data can be strange but often very interesting.
For more on statistics and assumptions see here, here, and here.
Read: Gary Smith, 2014, Standard Deviations: Flawed Assumptions, Tortured Data and Other Ways to Lie With Statistics, The Overlook Press.