
Marketing Metrics And Understanding Markets
Most metrics we discuss are related to the firm, or even the individual consumer. At some point in strategy discussions, however, a marketer will want to know what the market in general is like. Is this a very competitive market or not? How do we measure that? I have developed the Bendle Panda Index.
The classic way of doing this is the Herfindahl Index (aka the HHI). This is used by regulators, for example, the US Department of Justice uses it. This index can be a first step in thinking about the effects of a merger on the market. One can ask a question like: “What will the Herfindahl Index become if the merger goes ahead?” If the number is projected to be too high after the merger the regulator might say no, or at least investigate more thoroughly.
What Do We Want From A Metric?
Our Marketing Metrics book shows how to calculate the the Herfindahl index. This involves squaring market shares and adding them all together. The closer to one the resultant sum is, the less competitive the market given the (sometimes reasonable) assumption that fewer, larger competitors mean less competitive. The Herfindahl Index is pretty crude, though. it would be nice to have something more effective. I don’t really have that, but at least I have something that is much simpler.
A Simpler Measure Than The HHI
Squaring market shares seems too much math for my liking. So in the spirit of simple metrics, I invented a new measure of competitiveness; the BPI or Bendle Panda Index. It makes Net Promoter look complex and Gerd Gigerenzer could happily certify it as “fast and frugal”. The Bendle Panda Index is merely suggestive but hopefully it is a useful, or at least fun, metric to help find markets when the competitors really aren’t competing on objective factors.
The basic idea I am relying on is that when marketers have something that sets their products apart of objective value they will mention that in their advertising. When marketers have it they will flaunt it. The ‘it’ in question is the sort of thing that Itamar Simonson and Emanuel Rosen referred to as when products create Absolute Value for the consumer. You have ‘it’ when your offering is better and/or cheaper. When you have something to say a low price might feature in your advertisin or the advertising might give some details on better service. Alternatively, the advertising might state clearly and with credibility that this is simply a higher quality product. All these are the sort of objective features that when you got it (an objective distinguishing feature) you flaunt it.
Cute Animals Show A Lack Of Competition?
What then if you don’t have anything much to flaunt? This is when I suggest that marketers turn to cute animals. You might not be cheaper, you might not be better, you might not be more focused on delivering value to consumers. You might not have that much going for you at all. Still, you can always have a panda in your advertising.

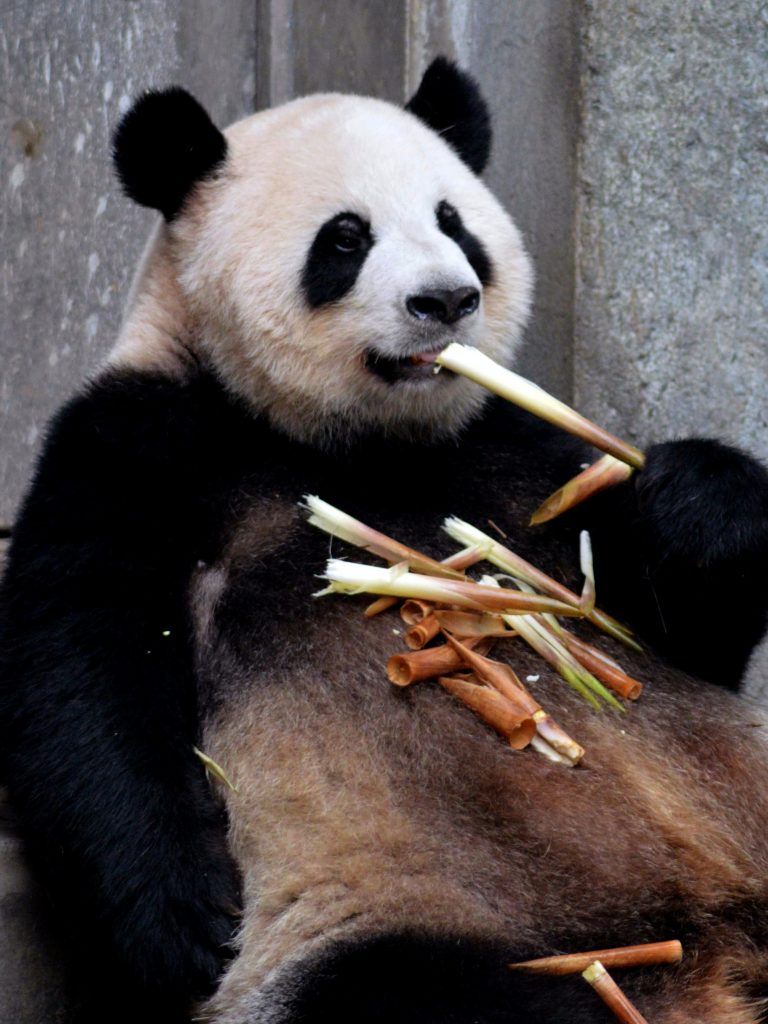
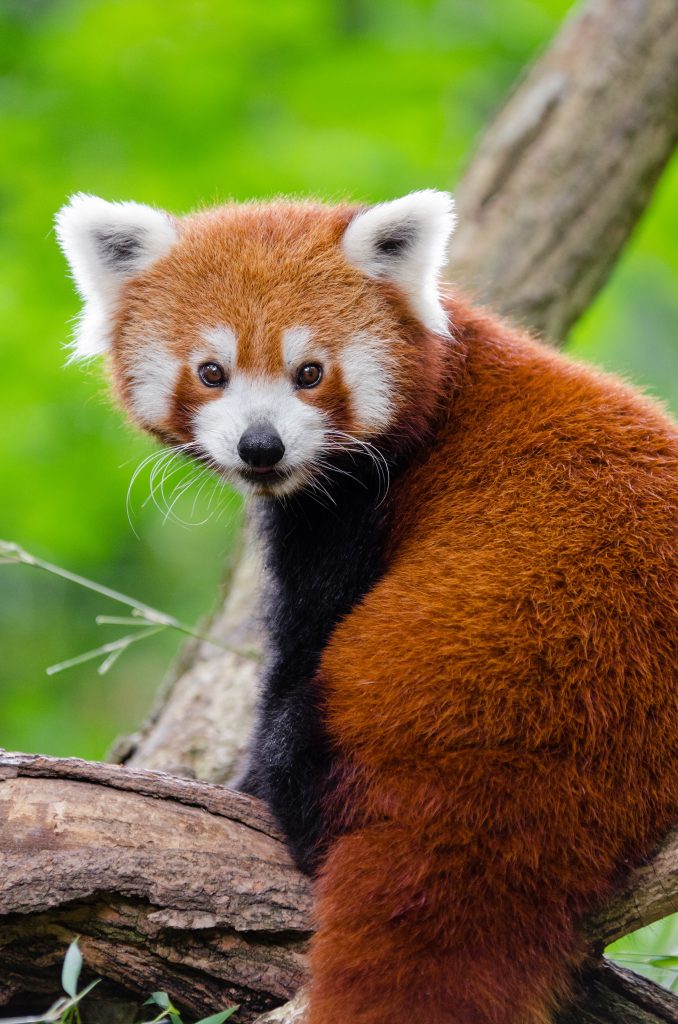
Of course, pandas in this analogy include any number of cute animals. You can be as daring as you want. Try any differentiation on cute animals as you wish.
The Bendle Panda Index
The idea behind the Bendle Panda Index is that the more cute animals used in advertising in the market then the less competition on meaningful differentiators that is going on. Put simply the Bendle Panda Index measures reliance on cute animals and uses the assumption that the more cute animals that are used the less intense competition is.

Formal Statement Of The Bendle Panda Index
The Bendle Panda Index, BPI, uses the principle that an industry’s competitiveness is inversely proportional to the effort that firms expend trying to distract you with the cuteness of the animals in the advertising. In competitive industries the firms compare prices and service quality, things that matter to consumers. Where the market is less competitive firms often try and differentiate on less critical dimensions. Basically, if lack of competition means all firms are all at roughly the same price and similar service level they must advertise something else and clever advertisers usually come up with the same answer: cute animals.
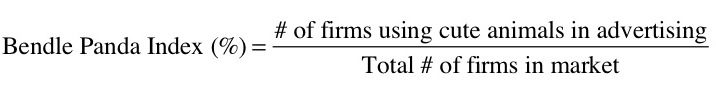
The Bendle Panda Index, thus, suggests that the less competitive any industry is the cuter the animals in the advertising. If competition is low, and creating better or cheaper offerings is hard work, then why not distract with some wonderfully cute baby mammals? To be specific, the BPI is the percentage of firms using cute animals in their advertising.
Advice for Marketers
Clearly to use a panda based strategy the marketers muyst first learn what is very cute. Are kittens cute enough? Of course not, everyone knows that kittens can’t beat pandas in a cuteness contest. Baby hedgehogs are surprisingly appealing, but maybe they don’t have quite enough to beat even an older panda. Otters holding hands is, of course, an excellent way to distract people from poor service quality. Koalas work for anything. If your offering is connected in some way to Australia that is great, but why be constrained by logic? Who says a a picture of a koala (with a baby koala) can’t work to sell lawn care in North America? Finally, who doesn’t love diminutive elephants. If your cell phone bill is too large at least the advertising is small and cute.
Sadly the BPI did not make it into our Marketing Metrics book. I am not going to pretend this is widely used in industry but it should be. The Marketing Metrics book is a bit more of a formal text. But why not buy it and see what other, perhaps more serious, metrics there are.
