
Cole Nussbaumer Knaflic has a useful book — Storytelling with Data. This contains lots of good advice on Creating Stories With Data Visualizations and generally improving data visualization. She tries to ensure the reader does not lazily follow the first thing a software (e.g., Excel) recommends. This is important, she gives many examples in the book where default Excel charts are pretty much unintelligible. She is also keen to emphasize the need to avoid fun gimmicks for gimmicks sake. “… I’ll articulate a relevant data visualization rule: don’t use 3D. It does nothing good, and can actually do a whole lot of harm…” (Knaflic, 2015).
You Don’t Get Marks For Effort So Don’t Show All Your Work
Another key piece of advice (that I personally need to remember) is “..it can be tempting to want to show your audience everything, as evidence of all the work you did and the robustness of the analysis. Resist this urge” (Knaflic, 2015). I do cringe a bit when I think of some of the work that I’ve done that falls into this trap.
Working With Baselines
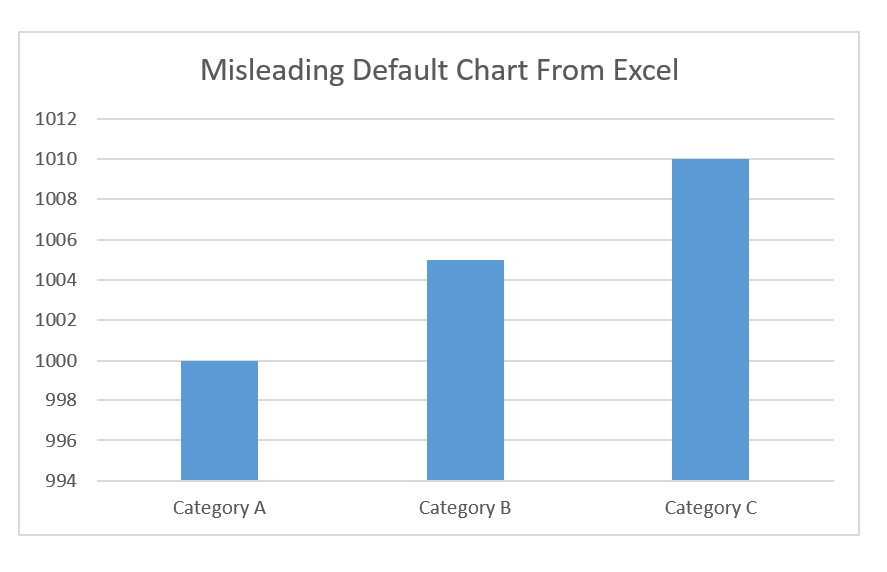
Throughout the book there are lots of useful pieces of advice. I can see why people find Knaflic’s advice helpful; it is practical, clear and, for a modest investment of time, should bring a high payoff in improving communication of data. I was interested to hear her thoughts on ethics and data visualization. There are some pretty deception visualizations out there so simple rules are useful: “bar charts must have a zero baseline” (Knaflic, 2015).
She is less dogmatic on line charts but even here be cautious. Messing with baselines to make an effect look bigger (or smaller) can be thought to be unethical and can certainly lose you credibility.
Creating Stories With Data Visualizations
Overall I like clear advice and Storytelling with Data contains this.
For more on visualization see here and here.
Read: Cole Nussbaumer Knaflic (2015) Storytelling with Data: A Data Visualization Guide for Business Professionals, Wiley
