
This post from 2013 is a hopeful one about declining overt bias found in polling. While we have had reasons to worry in the intervening years I still stand by the idea that declining overt bias is a good thing. We may not be perfect. I think this is pretty obvious to all, but, at a minimum, people realizing overt bias is not something you admit to is a positive sign.
Generally Well-qualified Person Question
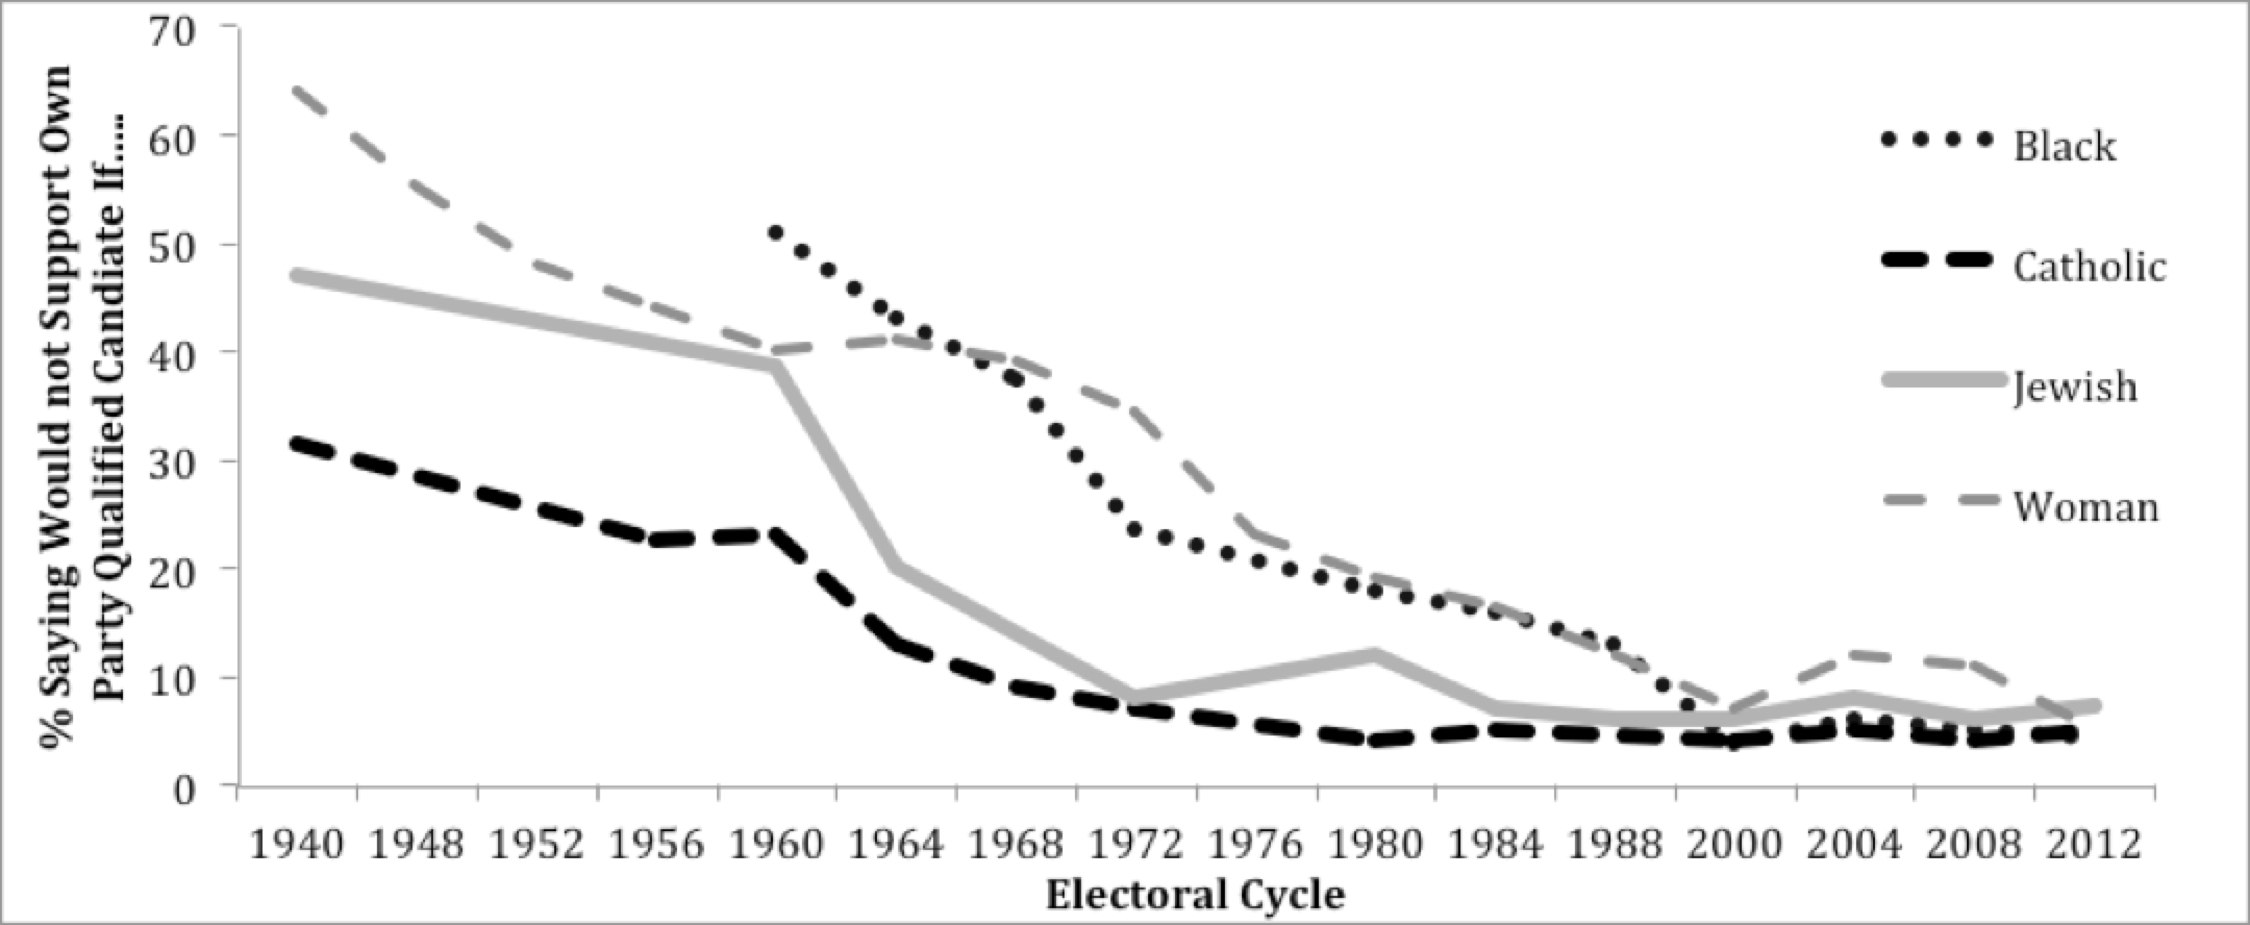
Gallup data measuring US voter prejudice goes back to 1937. They ask US adults: “If your party nominated a generally well-qualified person for president who happened to be {a woman, Black, a Catholic etc..}, would you vote for that person?”
The change since the 1940 electoral cycle, e.g. polls taken 1937-1940, is massive. In 1937, 64% of respondents (including women) said they would not vote for a woman, 47% would not vote for a Jewish candidate. The comparable 2012 numbers are 5% wouldn’t vote for a women and 7% for a Jewish candidate. Still too high, but dramatically smaller.
In reporting the 2012 results Gallup framed their results negatively: “Atheists, Muslims See Most Bias as Presidential Candidates” (Gallup 2012). I want to give a reason to be cheerful. Yes it still exists but look below at the chart of prejudice over time. Few trends relevant to political marketing are quite so powerful. Prejudice against female, black, Jewish and Catholic candidates has fallen precipitously.
Declining Overt Bias, But Is This Just Less Overt Bias?
A counter view is that nothing has changed; people are still prejudiced they just no longer admit to it. To dismiss the change seems unnecessarily pessimistic. In 1960, 51% said they would not vote for a “well-qualified” black candidate. In 2008 and 2012, more than half those who voted did so for a real African American candidate. (Real candidates perform worse than hypothetical “well-qualified candidates” as “well-qualified” is always debatable and real candidates never win over die-hards of the opposite party.) Furthermore I’d suggest social desirability concerns are by themselves evidence of progress. At least people know it is wrong nowadays. In 1937 most people weren’t even ashamed of their prejudice and so didn’t lie about it.
I created the graph for groups for which there are over twenty data points. Many who face prejudice today therefore aren’t plotted, e.g. measuring attitudes to gay people is relatively new. That said, even the fact that Gallup ask the question now is surely evidence of progress. An openly gay candidate in the US prior to 1962 was not something to poll about. Before decriminalization of homosexuality the gay candidate would have faced jail not reluctant voters.
Technical note: I averaged data points in a cycle and interpolated missing data. E.g. if 1964 is missing the line connects 1960 to 1968.

My headline: The percentage saying they would not vote for a well-qualified woman has dropped from 64% to 5%. This is in only a couple of generations. It might not be everything, but is surely a reason to be cheerful.
For more on polling see here.
Read: Gallup (2012), Atheists, Muslims See Most Bias as Presidential Candidates, Published June 21 2012, By Jeffrey M. Jones, Accessed May 26th 2013